


You're probably looking at a dashboard that says traffic is up, rankings are mixed, and calls are “better than last month,” yet you still can't answer the only question that matters. Did the phones ring because of the right searches, or did your marketing just make the spreadsheet look busy?
That's the trap for HVAC, dental, and pest control owners. You can spend real money, get a stack of reports, and still not know whether your site is winning transactional search terms like roofer near me, dentist near me, or air conditioning repair near me. Performance benchmarking fixes that by forcing every claim back to a number, a baseline, and a comparison you can defend.
The Moment a Local Business Owner Knows They Need Hard Numbers
The call comes in after lunch. Your marketing person says the campaign is “going great,” the agency sends a polished PDF, and the monthly meeting still ends with nobody knowing whether the work filled the schedule. That's the point where gut feel stops paying the bills.
A local owner doesn't need more noise. They need to know whether the website is showing up when someone in the service area types a buying-intent query, whether the Map Pack is pulling real calls, and whether those calls turn into booked jobs. If the answer is fuzzy, the business is flying blind.
Vanity reporting feels safe until payroll lands
A few charts can hide a lot. A spike in impressions doesn't matter if the phone stays quiet, and a better-looking average position means nothing if the query set is wrong. The historical roots of benchmarking are helpful here, because benchmarking started as a repeatable comparison method, not a vague scorecard. The early discipline was about measuring representative programs on different machines and evaluating response time, CPU utilization, and requests per second under defined conditions, which is exactly why the practice still works when it's applied correctly today. Pearson's benchmarking overview
Practical rule: if a report can't tell you what changed, against what baseline, and in which service area, it isn't a benchmark. It's decoration.
That's why owners get frustrated with generic marketing updates. They don't need a prettier dashboard. They need a system that shows whether their share of the right searches is improving, whether calls are rising, and whether booked jobs are keeping pace with spend.
The break point is usually scale
One technician can survive on instinct. A growing shop can't. Once you add paid ads, more service cities, or multiple office locations, you need a consistent yardstick, not memory and optimism. The discipline of performance benchmarking gives you that yardstick, and for service businesses it's the missing operating system for turning searches into booked work.
What Performance Benchmarking Means for a Service Business
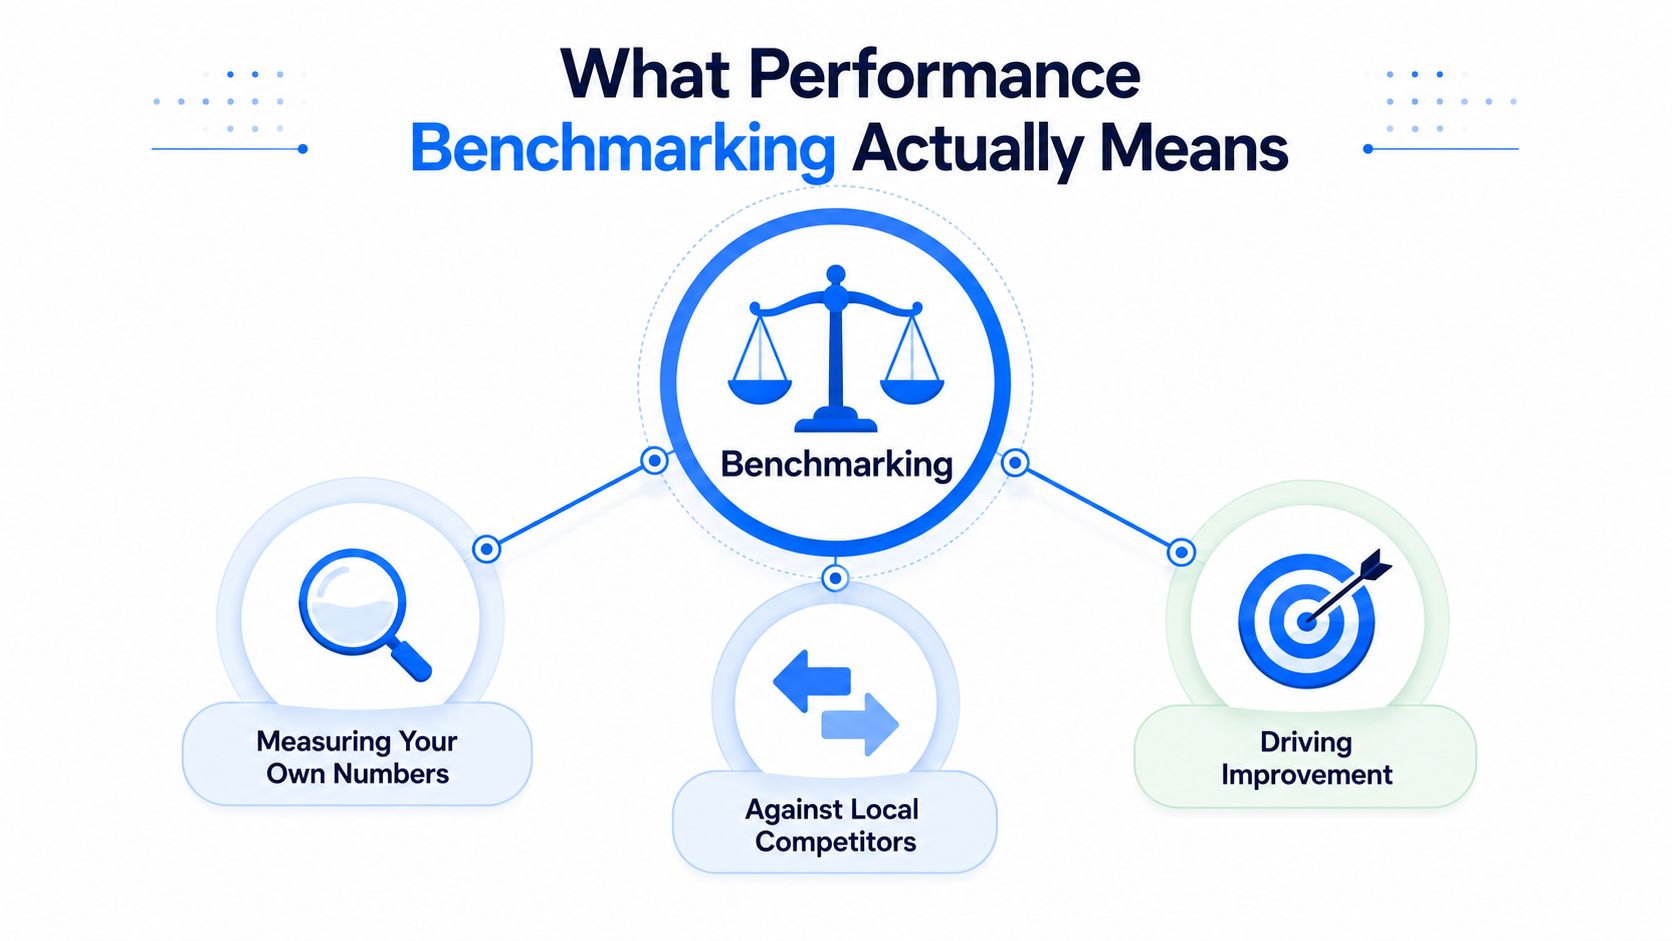
A service business does not need a fancy scorecard. It needs a clean comparison that shows whether the right searches are turning into calls, booked jobs, and revenue.
Performance benchmarking means comparing your numbers against your own history, local competitors, and outside standards so you can see what is working and what is dragging you down. The idea came out of repeatable measurement in technical testing, then moved into management because leaders needed a reliable way to compare performance across operations, finance, marketing, and customer experience. That history matters because benchmarking only works when the process is consistent, measurable, and tied to real business activity, not when it is used as decoration. Pearson's historical benchmarking chapter
What that means in local search
For a service-area business, the benchmark is the search behavior that leads to revenue. A homeowner searching roofer near me or dentist near me is not browsing for entertainment, they are ready to hire. The same applies to air conditioning repair near me, which is why local owners should measure visibility around terms tied to buying intent, not broad informational traffic.
The right comparison set is local. Measure yourself against the businesses taking calls in the cities, neighborhoods, and service zones you serve. Anything broader blurs the picture and hides the problems that affect booked work.
If you want a clearer business-side view of turning operational data into decisions, AetherCloud's analytics for trades is a useful companion read. It shows why measurement matters only when it changes how the business operates.
The definition that holds up in practice
A usable benchmark needs three things, a workload, a baseline, and a comparison. For a local service company, that means specific search terms, specific service areas, and one fixed method for counting the result. Move those pieces around and the comparison breaks. You are no longer benchmarking, you are watching noise.
A good benchmark is repeatable next month and still gives your team the same kind of answer, even when the numbers move.
That is the standard to keep. You want a comparison that shows where to push harder, where to hold the line, and where to stop spending money that is not producing booked jobs.
The Five Metric Groups That Actually Move the Needle
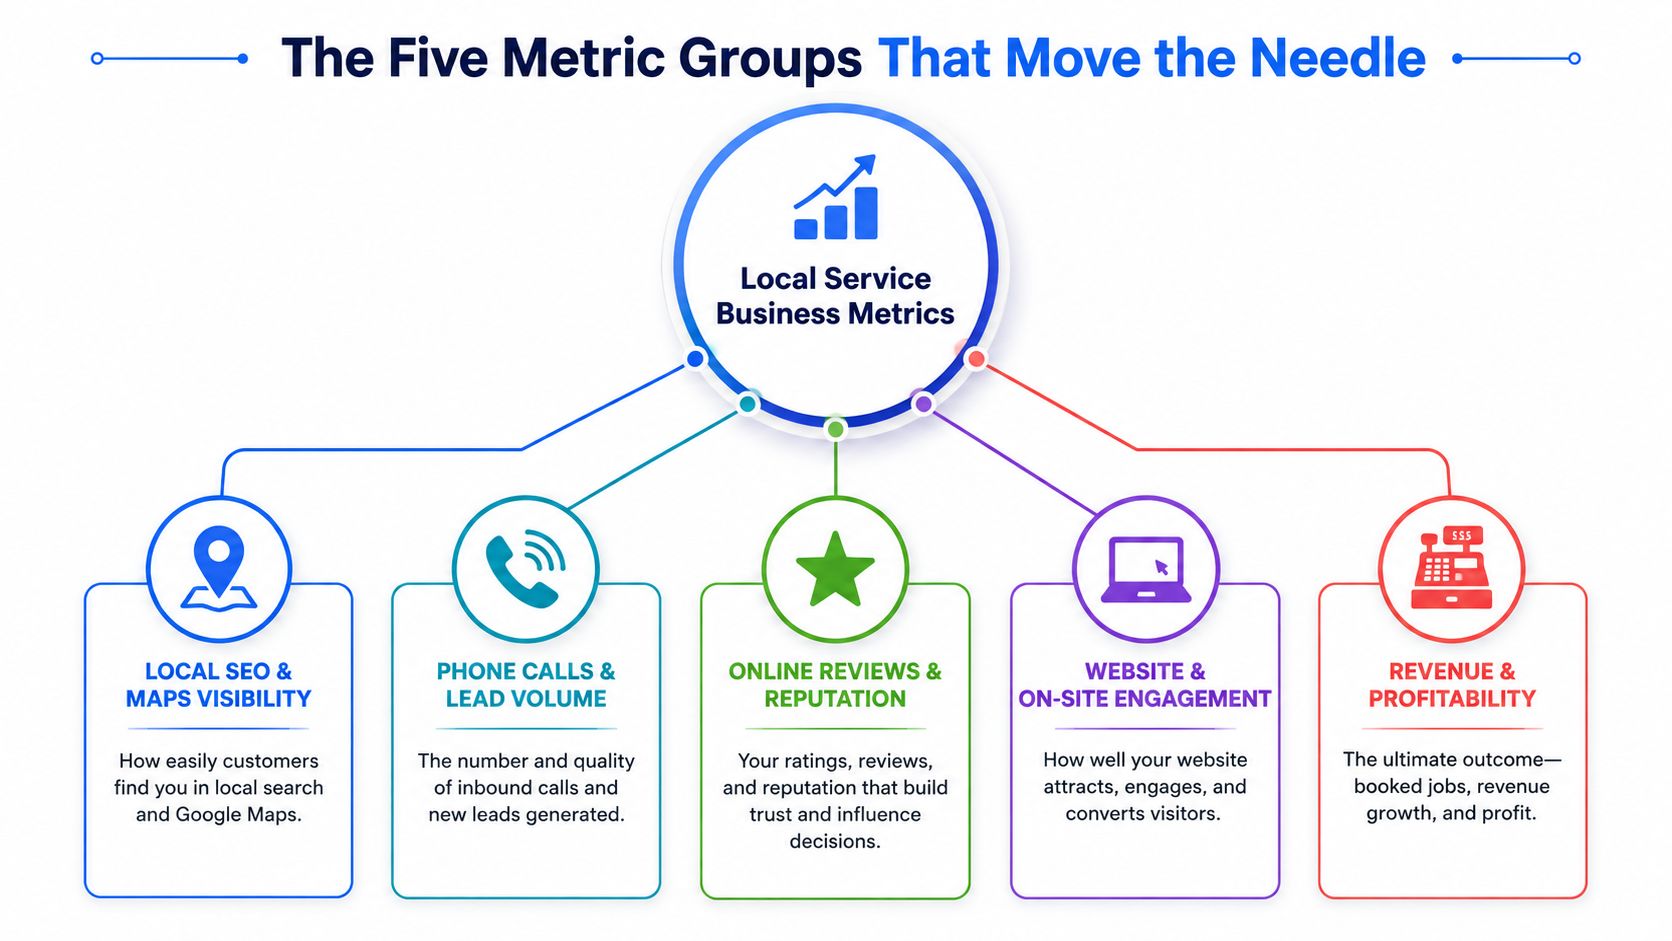
The metrics that matter for a local service company fall into five groups, and anything outside those groups is usually a distraction. You're not trying to win a marketing award. You're trying to get found on transactional searches, get the call, book the job, and make the customer worth having.
1 Local SEO and maps visibility
This is the first filter. If your pages and your Google Business Profile don't show up for the searches people use before they buy, the rest of the funnel doesn't matter. Benchmark the rankings for your core transactional terms, the visible presence of your service pages, and whether your city or neighborhood pages are indexed and relevant.
2 Phone calls and lead volume
Calls are where local intent shows up in the world. Search impressions are useful only if they lead to contact. The practical metrics here are call counts, unique callers, call source, and whether the calls come from Maps, organic search, or ads. For call tracking setup, see the internal guide on how to track phone calls.
3 Conversion from lead to booked job
A lead that never turns into revenue is a liability, not an asset. Conversion rate, first contact resolution, and booking rate matter here. First contact resolution belongs here because service businesses lose a shocking amount of value when the first call goes unanswered or the office misses the follow-up.
4 Revenue efficiency
This group is where the numbers get serious. Track revenue growth, gross margin, and customer acquisition cost with a hard baseline. A standard revenue growth formula is to divide the change in revenue by starting revenue and multiply by 100, which is what makes the result comparable over time and across businesses. That kind of numerical structure is why benchmarking is useful in the first place. Comparable's KPI benchmarking guide
5 Customer lifetime value
A job isn't the end of the story if the customer comes back or refers others. Lifetime value shows whether the acquisition engine can keep funding growth. If your LTV is weak, you'll feel pressure to chase more leads at any price, and that's how local businesses end up buying bad traffic.
For content performance and the way the message supports the numbers, TheBestReputation content analytics is a useful reference point. It's a clean reminder that the message should be measured against outcomes, not applause.
Bottom line: more visibility should create more calls, better conversion should turn calls into revenue, and stronger LTV should fund the next round of visibility work.
That loop is the whole game. If one link is weak, the benchmark tells you exactly where the leak is.
How to Collect Benchmark Data Without Lying to Yourself
The fastest way to ruin benchmarking is to compare messy data to a fantasy competitor set. The second-fastest way is to pull numbers from too many places without defining how they were counted. Good benchmarking starts with a controlled process, and the UK's official guidance lays it out as a seven-step discipline, from confirming objectives and setting metrics through gathering, validating, and reviewing the benchmark figure before reuse. UK Government benchmarking guidance
Start with a baseline you can defend
Choose the exact service line, city, and search term set before you look at results. Then lock the measurement rules. A benchmark is only meaningful when the workload, environment, and configuration are described well enough that another person could reproduce the same comparison and verify it. That's not academic fussiness, it's the only way to keep a report honest. Benchmarking definition and reproducibility guidance
Use the right sources, not the most sources
For local businesses, the useful inputs are straightforward. Google Search Console shows query behavior, Google Business Profile insights show local engagement, call tracking shows source and volume, CRM reports show lead status, and map-ranking heat maps show service-area visibility. None of those alone is enough. Together, they give you a working picture of demand, visibility, and conversion.
A bad peer set destroys the exercise. Comparing a single-location dental office to a multi-location chain with a broader service footprint creates fake gaps. The same problem appears if you compare a mature HVAC brand with a brand-new website and act surprised that the numbers don't match.
Normalize before you compare
Raw data must be validated and normalized before comparison. If one office tracks calls differently, or one service area includes more zip codes, the benchmark stops being a benchmark and becomes a muddle. The point is to compare like with like, then test whether the gap is real.
If you can't explain why two numbers are comparable, don't compare them.
That rule saves money. It also keeps the team from chasing a “problem” that's really just a measurement error.
Realistic Target Benchmarks for Local Service SMBs
Use this table as a working wall chart, not a fantasy promise. The right target depends on your market, but you still need a floor, a healthy range, and a best-in-class goal so the team knows whether it's behind, on track, or ahead.
| Metric Group | Floor | Healthy | Best-In-Class |
|---|---|---|---|
| Transactional keyword visibility | Limited visibility on core buying-intent terms | Consistent page-one presence on core terms in key cities | Strong presence across core terms and adjacent service-city variations |
| Google Maps visibility | Occasional Map Pack appearances | Regular top-three presence in priority service areas | Dominant top-three presence across primary service zones |
| Calls from organic and Maps | Leads arrive inconsistently | Stable monthly call flow tied to local search demand | Reliable call volume with strong source attribution |
| Lead-to-booked-job conversion | Too many leads stall after first contact | Healthy conversion from lead to booked job | Tight follow-up and high booking efficiency |
| Customer value versus acquisition cost | Spend feels high relative to return | Clear path to healthy unit economics | Strong LTV relative to acquisition cost and repeat demand |
A benchmark must pair a clearly defined workload with fixed rules, which is why this table focuses on business outcomes instead of vague traffic talk. If throughput in your funnel rises while conversion falls, the benchmark is telling you the business is leaking somewhere downstream. If the opposite happens, you may have a visibility problem, not a sales problem.
The strongest local operators also watch for tail behavior. Averages can make a weak month look harmless and hide the bad calls, slow follow-up, or low-quality traffic that killed the margin. That matters even more now that search results are changing under AI-influenced discovery, where a higher score can still reflect a narrower or more gameable test rather than a better system.
For calculating acquisition cost cleanly, use the internal guide on how to calculate cost per acquisition. That's the number that keeps the whole benchmark tied back to unit economics instead of ego.
For a practical companion on marketing measurement, how to measure marketing effectiveness is worth keeping nearby. It reinforces the same point, which is that benchmarks only matter when they connect to actual business decisions.
A Sample Monthly Benchmarking Dashboard That Drives Decisions
A good dashboard is boring in the best way. It shows the same numbers every month, in the same order, so the owner can spot movement without hunting for it. That consistency is what makes the results decision-grade rather than decorative.
Start with leading indicators on top and lagging indicators underneath. Rankings for transactional terms, Maps visibility, and search impressions belong in the first layer because they tell you whether demand is finding you. Calls, booked jobs, revenue, and lifetime value belong in the second layer because they show whether the attention turned into money.
The dashboard structure that actually works
Use a monthly one-pager with three bands:
- Visibility band: core keyword rankings, local pack presence, Search Console queries
- Demand band: calls, form fills, unique leads, missed-call rate
- Money band: booked jobs, revenue, acquisition cost, LTV
That layout keeps the conversation honest. If visibility improves but demand stalls, the team has a problem with calls or conversion. If demand rises but booked jobs don't, the office needs better follow-up. If booked jobs are up but unit economics are weak, you're buying growth the hard way.
A useful benchmark also needs recurring review. Weekly check-ins work for traffic and call volume, monthly reviews work for conversion and acquisition cost, and quarterly reviews work for lifetime value and market position. The same comparison should be repeated over time with the same rules. Confidence intervals and independence checks matter because one run can lie to you if the runs are correlated, noisy, or drifting over time. Rigorous benchmarking guidance
What to ask every month
A strong owner asks three questions every time. Did the right transactional terms improve? Did that create more qualified calls? Did the calls become booked work at a profitable rate?
For a transparent reporting model, one page KPI tracker by Nexist is a useful reference because it shows how a compact scorecard can keep teams focused on a small number of consistent metrics. That's the right mindset for a local operation.
If you're building your own internal view, the internal performance dashboard should mirror the way your market behaves, not the way a generic agency template looks.
Your 30-60-90 Day Action Plan to Move the Numbers
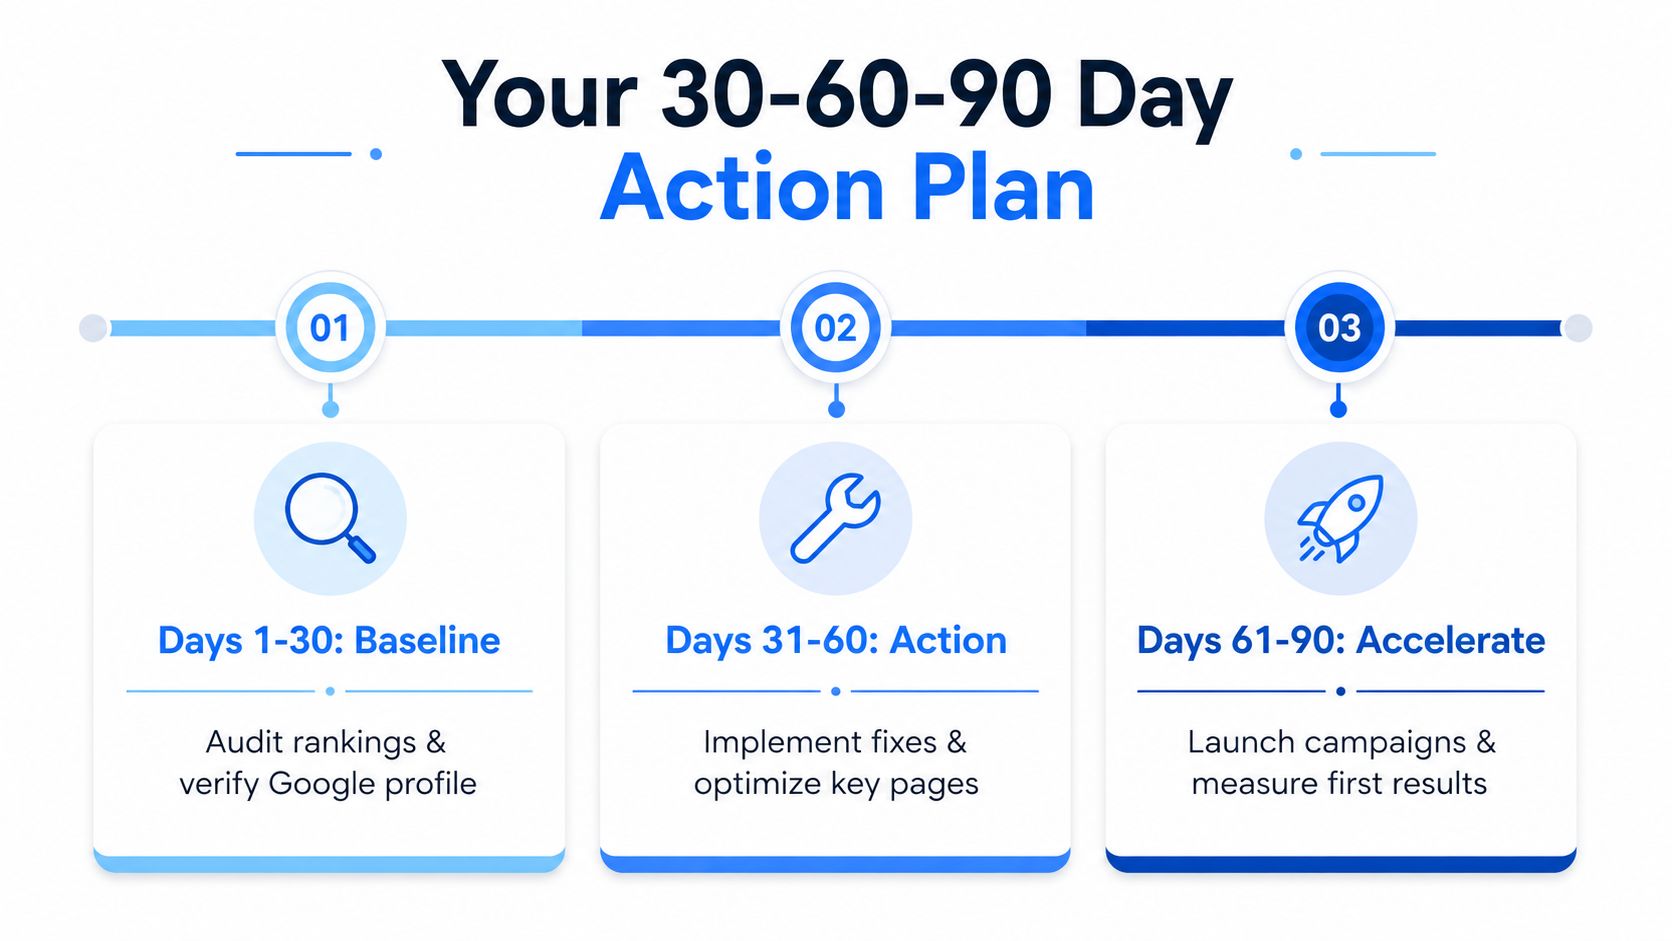
Days 1 to 30 are for baseline. Audit your current rankings on transactional search terms, verify Google Business Profile completeness, install call tracking, and pull the last 90 days of leads and revenue. If you don't know where you're starting, every later improvement is just a guess.
Days 31 to 60 are for closing the gap. Tighten Google Maps optimization for the top-three in your service area, build a content silo around transactional terms, and clean up the website so it converts calls and forms more reliably. That's where the benchmark starts turning into movement.
What to measure in each phase
- Baseline phase: current keyword visibility, Maps presence, lead source mix
- Action phase: ranking movement, call growth, conversion quality
- Acceleration phase: repeat performance, city expansion, next-quarter target setting
Days 61 to 90 are for compounding. Re-benchmark the same terms, set the next-quarter targets, and expand into adjacent service cities and search terms that fit the same buying intent. A business stops reacting and starts building a repeatable local growth engine.
The reason this works is simple. Performance benchmarking turns local SEO from opinion into operating discipline. It also supports the kind of search visibility Transactional Marketing is built to pursue, including page-one movement in the 30 to 60 day window when the baseline, the site, and the local map work are all aligned.
If you're ready to stop guessing and start measuring the searches that bring in money, talk to Transactional LLC. They build local SEO and Google Maps systems for service businesses that want more transactional search traffic, more calls, and a cleaner view of what's working.