


A plumber can finish a strong month, collect more deposits than last year, and still lose ground across the city. The same thing happens to HVAC contractors, dentists, roofers, and pest-control companies when local demand grows faster than their businesses do. More revenue feels like progress, but it doesn't answer the competitive question: are you capturing a larger share of the searches, calls, appointments, and jobs available in your service area?
That question matters most on Google Maps and in high-intent search results. A business that appears for “air conditioning repair near me,” “roofer near me,” or “dentist near me” is competing for customers who are much closer to taking action than someone researching general information. Transactional Marketing focuses on those searches, then connects visibility to calls, booked jobs, and patients rather than vanity metrics.
Why Revenue Growth Is Not Market Share Growth
A local plumbing company might increase revenue because the winter was colder, a competitor stopped answering calls, or the entire city experienced a surge in emergency repairs. None of those outcomes proves the company captured more of its market. If every competitor grew faster, the plumbing company earned more money while becoming less competitive.
Market share is relative. For a local service business, it can mean the portion of service requests, booked appointments, qualified calls, or category revenue captured compared with other providers serving the same geography. The right denominator depends on the decision being made. A roofing company may measure booked replacement projects across selected suburbs, while a dental practice may measure new-patient appointments for specific treatments within its reachable area.
The rising-market trap
Consider a plumber serving three nearby cities. The owner reviews the books and sees revenue growth, so the marketing budget appears justified. Meanwhile, a rival has built stronger Google Business Profile visibility, collected more recent reviews, and created dedicated pages for emergency plumbing in each suburb. The rival is steadily taking the searches that used to reach the established company.
That loss often stays hidden because revenue doesn't show where demand went. Search impressions, map visibility, calls, booked jobs, and service-line performance reveal the change earlier. A business can retain loyal customers while losing new demand, which creates a delayed problem when repeat work slows.
Practical rule: Treat revenue as an outcome, not as proof that your competitive position improved.
Market share growth therefore requires two comparisons. First, compare your current performance with your own past performance. Then compare it with the total opportunity and the competitors appearing for the same services and locations. A share of voice SEO framework can help local operators connect ranking visibility with the searches their competitors already own.
The rest of the operating question is straightforward: where is share available, how do you measure it without fooling yourself, and which transactional searches can turn visibility into profitable work?
Measuring Your Local Market Share Correctly
Measurement breaks down when the business, the market, and the reporting dashboard use different definitions. A contractor may count every job from the whole company, then compare that total with a market estimate covering only one suburb and one service category. The resulting percentage looks precise but describes nothing useful.
Start by defining the boundary. Write down the service cities, category, customer type, and channel included in the calculation. “HVAC in the metro area” is too broad if the company only serves selected suburbs or makes most sales through Google Maps. A usable boundary might be residential air-conditioning repair in named service cities, measured through calls, booked jobs, and category revenue.
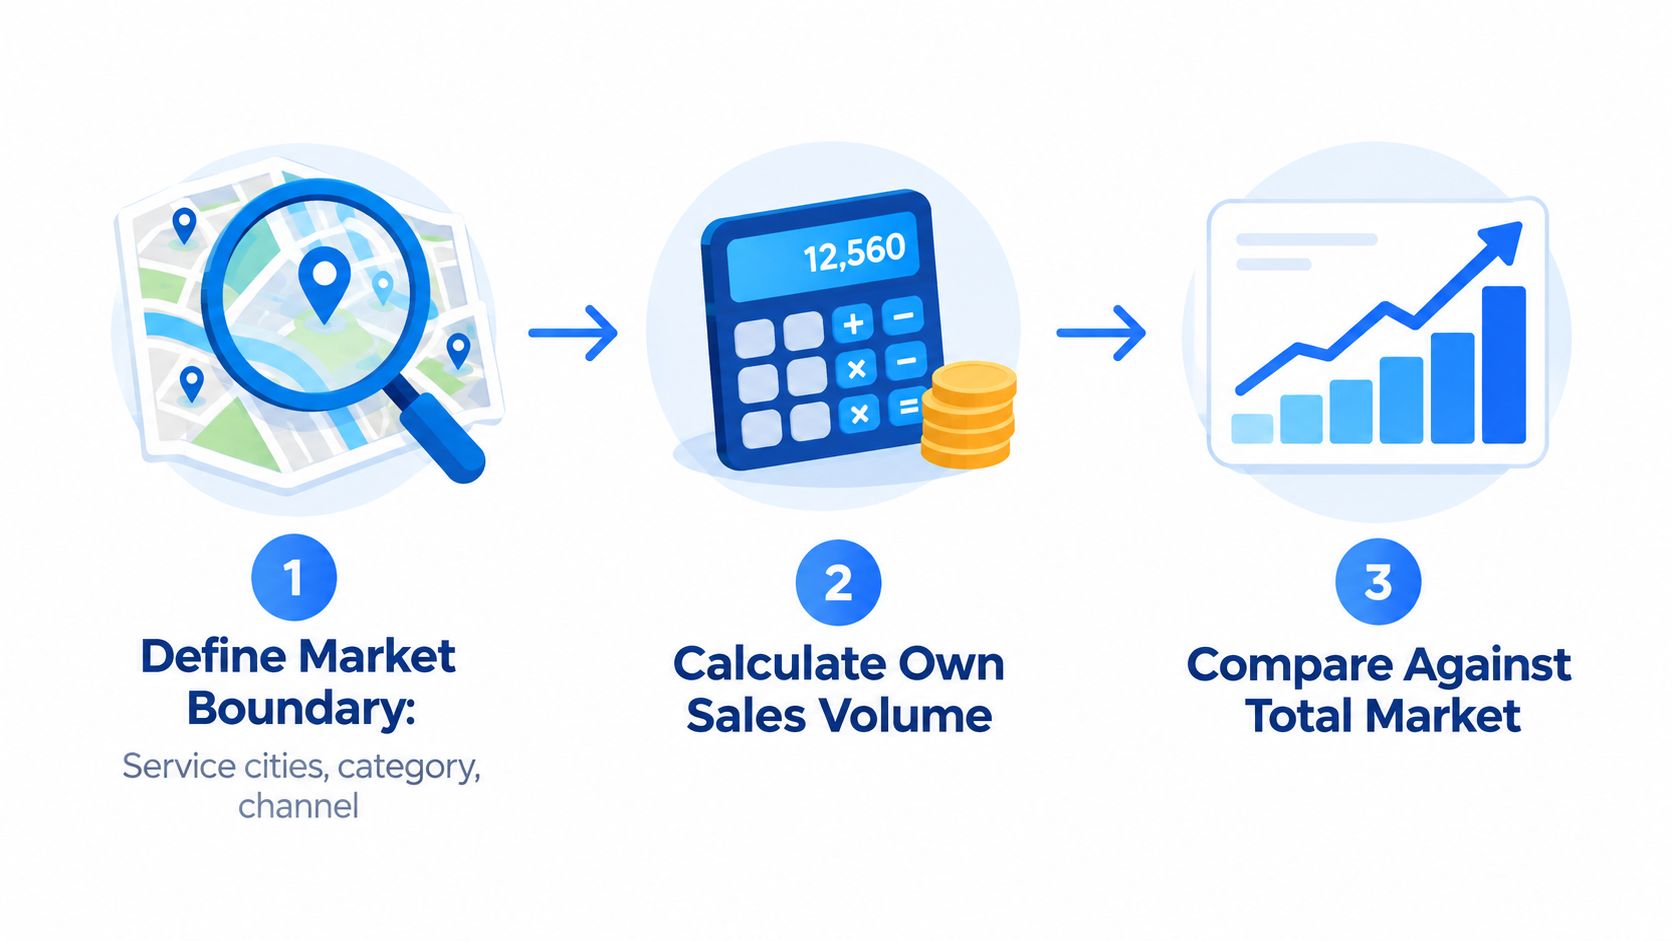
Match the numerator and denominator
Internal sales data and external market estimates must use the same taxonomy. If your numerator includes maintenance contracts but the market total covers repair calls only, the comparison is distorted. Harmonize geography, service definitions, customer segments, and channels before calculating anything.
Use two views rather than trusting one estimate:
- Top-down view: Start with an external estimate of total category demand in the defined area, then compare your revenue, jobs, or appointments with that total.
- Bottom-up view: Add observable competitor activity, estimated job capacity, call demand, booking data, and your own completed work to form a grounded local picture.
- Triangulated view: Compare the two approaches and investigate material differences instead of selecting the more flattering result.
Measurement rule: Use both top-down and bottom-up methods, then reconcile the differences before making a budget decision.
The market share analysis guidance from Umbrex recommends triangulation, consistent taxonomy, and refreshing total-addressable-market inputs at least semi-annually. For a local operator, that means revisiting service-area demand and competitor coverage regularly rather than relying on an old market estimate.
Separate volume from value
Revenue can rise because prices increased, a premium service mix improved, or discounts attracted more low-margin work. Track value share and volume share separately. Then break value movement into price, volume, and mix so a discount-driven revenue bump doesn't masquerade as genuine share growth.
For an HVAC company, booked repair jobs may be the operational volume measure, while revenue measures value. If revenue rises but completed jobs stay flat and realized prices fall, the company may be buying demand rather than gaining durable position. Add map-pack visibility, calls, booked appointments, cancellation rates, and gross margin to the same reporting view.
Common failures include incomplete service mapping, mixing cities, ignoring channel differences, and allowing stale market-size data to remain in the denominator. A local performance dashboard should show the definitions behind each metric, not just a polished chart with unexplained percentages.
Diagnosing Where Share Gains Are Actually Possible
Not every market offers an equal opening. Some local categories are crowded, while others are dominated by one operator with strong map visibility, broad service coverage, and a steady flow of reviews. Trying to displace that leader everywhere wastes budget when a narrower segment could produce faster competitive gains.
Large digital markets show the same structural pattern. Windows held about 71–72% of the global desktop operating-system market as of June 2025, according to market-share reporting from SearchLab. Google still held 91.31% of global search in July 2026, while the same broader coverage describes AWS retaining cloud infrastructure leadership as Google Cloud gained ground, even as the market expanded. The lesson for a local business isn't to copy a national leader. It's to identify the battleground where the incumbent is exposed.
Find the winnable segment
Map competitors by service city and service line. A roofing company may find that the main competitor dominates general roofing searches but has weak coverage for storm damage inspections. A dental practice may see strong competition for “dentist near me” while orthodontic or emergency appointment searches remain poorly served. An HVAC operator may have an opening in after-hours repair, a specific suburb, or a neglected equipment category.
Share of growth, or SOG, adds useful context. It divides the company's revenue change by the total market revenue change, helping distinguish competitive gains from growth that only follows an expanding category. Industry KPI guidance describes consistent annual market-share growth above 5% as a strong target in many categories, but SalesGlobe's market-share measurement guidance stresses that the target must be tested against sector volatility, competitor activity, profitability, and capacity.
| Market condition | What it signals | Recommended play |
|---|---|---|
| One operator dominates broad searches | The category may be winner-take-most | Target a service line, suburb, or response-time gap |
| Several competitors have similar visibility | Share can move through execution quality | Improve relevance, reviews, conversion, and follow-up |
| Demand is expanding faster than your business | Revenue may hide falling relative position | Track share of growth and category demand |
| Competitors rank but respond slowly | Customers may be underserved | Build fast call handling and clear booking paths |
| Your visibility is strong but bookings are weak | The problem may be conversion or capacity | Fix landing pages, intake, pricing clarity, and scheduling |
Broad expansion often underperforms focused expansion. The Square service business KPIs resource from ViralRef is useful when choosing operating measures beyond raw revenue, particularly when a service business must connect marketing performance with delivery capacity.
Before publishing pages or increasing ad spend, complete a competitive keyword analysis for each service city. The objective isn't to collect a huge keyword list. It's to find the specific transactional terms where competitors are visible, customers are ready to act, and your business can deliver reliably.
Winning the Google Map Pack in Your Service Areas
For local service businesses, Google Maps is often the clearest expression of market share. A company can rank well organically and still lose urgent calls if another provider occupies the most visible map results for the searches that matter.
Google's local pack system centers on relevance, distance, and prominence, as described in this explanation of Google Maps ranking factors. Relevance means the profile and website match the service query. Distance reflects proximity to the searcher or selected location. Prominence reflects the business's authority and trust signals.
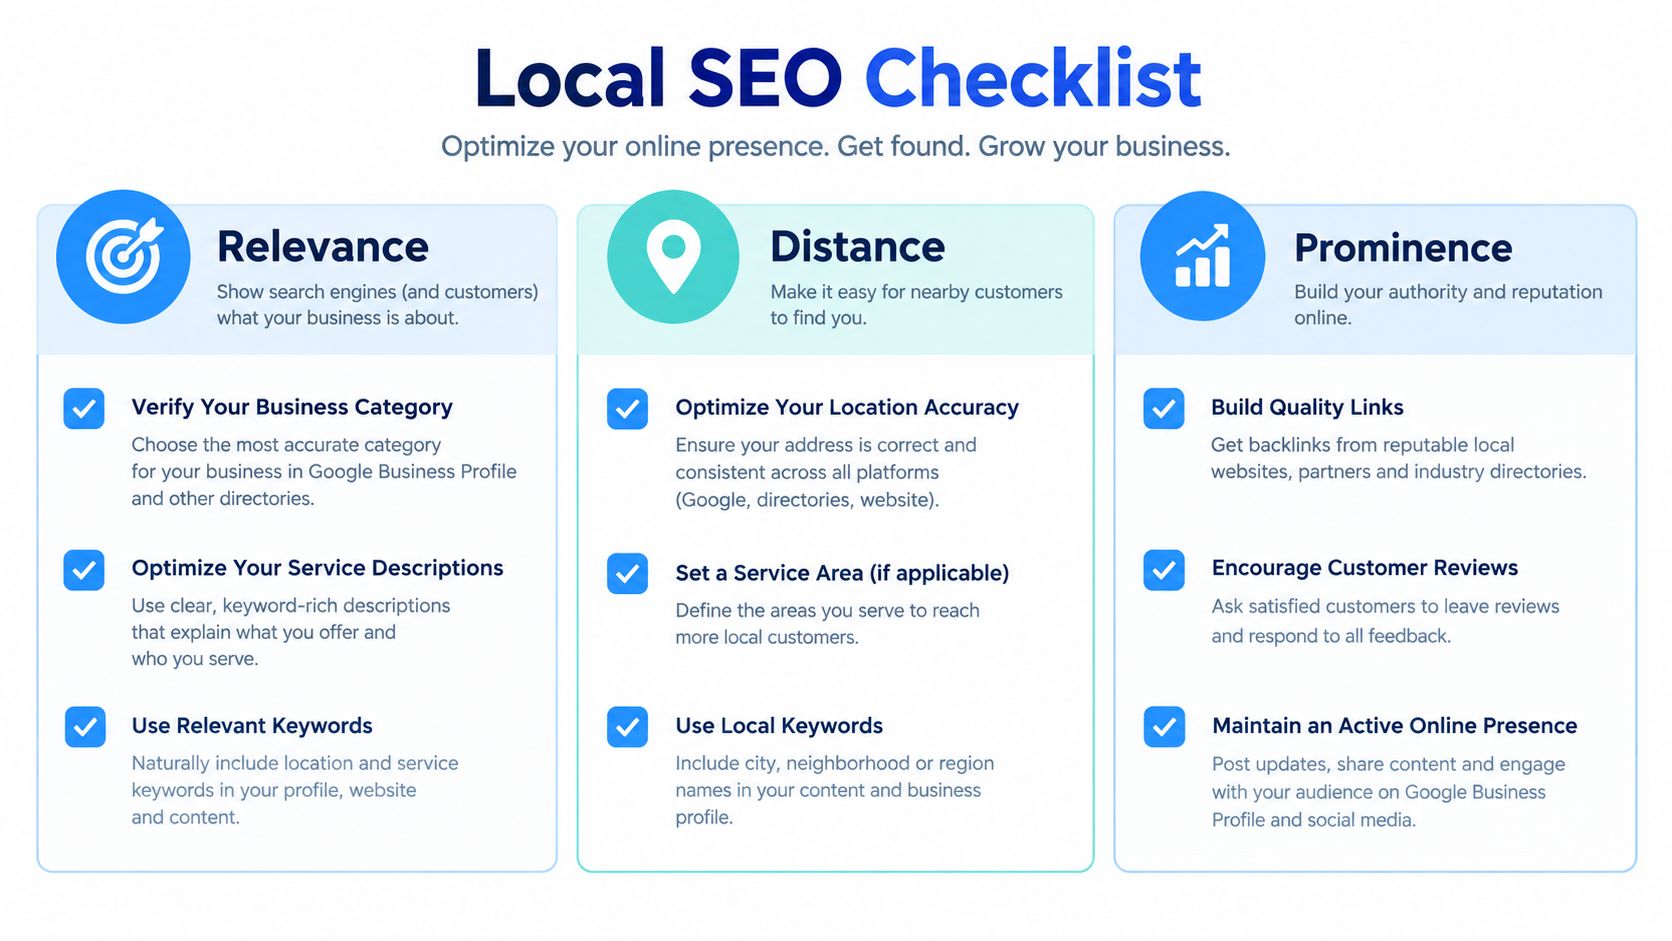
Turn the three factors into work
Relevance starts with accuracy. Choose the correct primary category, add legitimate secondary categories, complete every relevant service field, and describe the actual work performed. Create service pages for air-conditioning repair, drain cleaning, roof replacement, pest treatments, or dental emergency care instead of forcing every offer onto one generic page.
Distance requires honesty. Keep the business address, service areas, and location information consistent. Don't create fake offices or claim coverage your technicians can't support. A map strategy that generates calls from locations you can't serve creates poor customer experiences and weakens the economics of every lead.
Prominence grows through evidence. Build a repeatable review process after completed work, standardize business name, address, and phone information across important directories, earn relevant local links, and publish authentic project or treatment imagery. Review requests should follow successful jobs, not arrive in an unexplained bulk wave.
A 2026 analysis citing Whitespark's local ranking survey assigns 32% of local-pack weight to Google Business Profile signals, 20% to review signals, and 15% to on-page signals, totaling 67% across those measured categories, according to the Stacc analysis of Google Maps ranking factors. Those figures don't replace judgment, but they reinforce where operators should spend time first.
A one-week map audit
- Profile completeness: Verify categories, services, hours, phone details, photos, booking links, and business description.
- Service-area accuracy: Check every city and suburb against actual dispatch coverage.
- Review operations: Ask satisfied customers for honest reviews and respond to every review with specific, human language.
- Citation consistency: Correct mismatched names, addresses, phone numbers, and service descriptions.
- Conversion path: Call the tracked number, test the booking form, and confirm that mobile visitors can request service quickly.
Paid search can cover urgent gaps while map visibility develops. Businesses that need a practical primer can review how to set up Google Ads for local businesses, then target the same service-and-city combinations used in the organic plan. For deeper implementation detail, use this guide to rank higher on Google Maps.
Targeting Transactional Search Terms That Convert
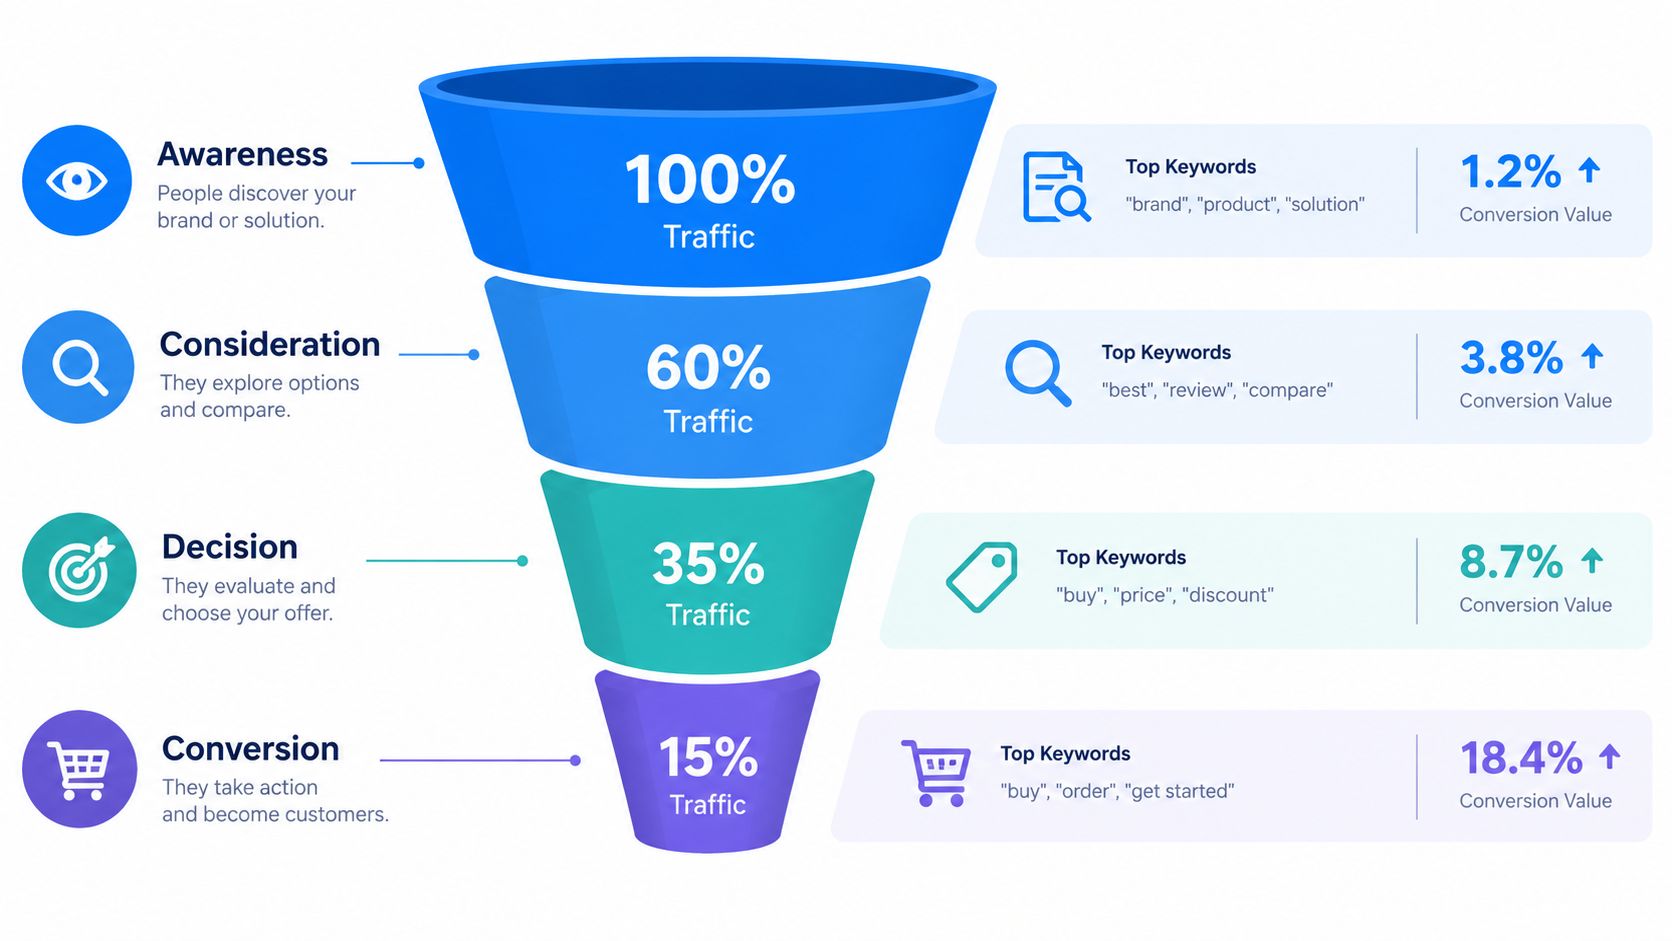
A search for “how does an air conditioner work?” signals research. A search for “air conditioning repair near me” signals a possible service request. Transactional queries commonly use action-oriented terms such as buy, order, price, discount, sale, subscribe, cheap, and near me, as outlined in Search Engine Land's guide to search intent.
Transactional Marketing is named for this distinction. The objective is to help clients appear when customers search “roofer near me,” “dentist near me,” “emergency plumber [city],” or another exact phrase connected to an immediate need. These users aren't merely building awareness. They may be choosing whom to call, book, or visit.
Build the map before writing
Start with a service-city matrix. Put each core service on one axis and each actual service city on the other. Then assign one primary transactional phrase and several close variants to the page that should rank for it.
For example:
- HVAC: Air conditioning repair near me, AC installation in [city], emergency HVAC repair [city]
- Roofing: Roofer near me, roof replacement [city], storm damage roofing [city]
- Dental: Dentist near me, emergency dentist [city], dental implants [city]
- Pest control: Pest control near me, termite treatment [city], rodent removal [city]
Don't create thin pages by swapping city names into identical copy. Each service-and-city page needs useful local context, clear eligibility, service details, proof of experience, pricing guidance where appropriate, and a direct call or booking path. The page should answer the customer's practical questions before the phone rings.
Build topical depth that assistants can use
An AI-driven content engine can organize these pages into silos: core service pages, city pages, supporting problem pages, FAQs, comparison content, and maintenance guidance. The purpose isn't to flood the site with generic articles. It is to give search engines and language models a consistent, crawlable description of what the business does, where it operates, who it serves, and how customers can take the next step.
AI optimization extends the same visibility problem beyond traditional search results. Businesses increasingly need their services, locations, reviews, and expertise represented clearly enough for LLMs and AI assistants to identify them when users ask for a local recommendation. Structured service information, consistent business details, useful first-party content, and credible third-party references all support that discoverability.
Use automation for planning, internal linking, briefs, publishing workflows, and content refreshes. Keep human review for medical, financial, safety, licensing, and location-specific claims. A dentist's implant page and an HVAC refrigerant page shouldn't read like interchangeable templates. Industry-specific content is how a local brand earns relevance for the exact searches it wants to own.
A Realistic Timeline From Launch to Local Dominance
A focused campaign usually starts with cleanup, not content volume. A representative HVAC company might spend the first weeks correcting its Google Business Profile, confirming service boundaries, fixing inconsistent directory information, improving core service pages, and building a review request process tied to completed jobs.
During the next phase, the team watches map visibility by city and service rather than relying on one average ranking. A profile may begin appearing for a suburb where relevance and distance are strong before it gains traction across the entire service area. Calls should be recorded by source, and the intake team should identify whether each caller found the company through Maps, organic search, paid search, or a referral.
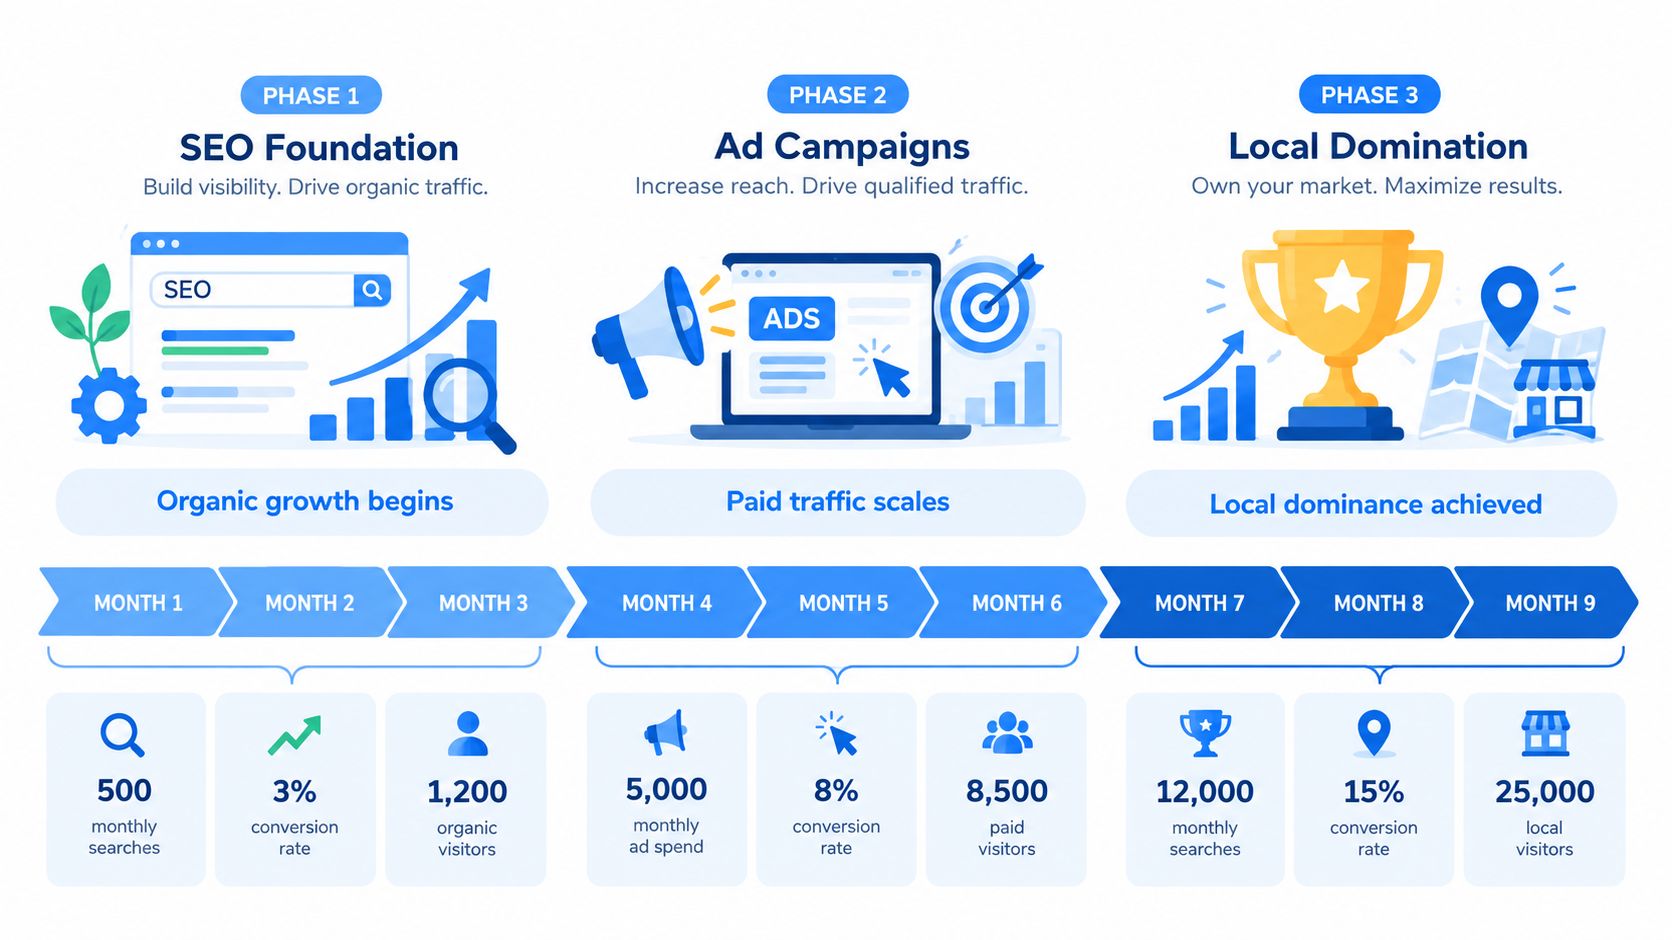
What the first 90 days can look like
In weeks one through four, the operator establishes the baseline. That includes current map-pack positions, Search Console queries, calls, booked jobs, service-city coverage, and the competitors appearing for each priority term. The company also launches its review rhythm and fixes conversion friction on mobile.
Within a focused campaign, first-page rankings for selected transactional terms commonly arrive in 30 to 60 days, but timelines vary by competition, site history, authority, technical condition, and service area. A roofing company may see early movement for a specific suburb and storm-damage service before broad “roofer near me” visibility improves. A dental practice may gain traction for emergency appointments or a treatment-specific query before competing for its broadest term.
Content silos go live alongside the foundational work. Referral relationships can provide legitimate local exposure, while paid search fills demand gaps for urgent services. Paid campaigns shouldn't hide weak organic fundamentals, but they can help the business capture high-intent searches while pages and profiles mature.
The reporting dashboard should show keyword timelines by city, map heat maps, Search Console queries, calls, and booked outcomes. Biweekly reporting gives the owner enough feedback to adjust service priorities without reacting to every daily ranking fluctuation.
Add channels without losing the plot
A local business network can create referral opportunities when similar companies promote each other appropriately. An electrician, roofer, plumber, and HVAC contractor may serve overlapping customers without selling identical services, making referral coordination practical when the customer experience remains the priority.
Paid search uses the same intent map as SEO. If “emergency plumber [city]” produces profitable jobs and the company can answer promptly, ads can support that term while organic visibility compounds. If calls go unanswered or technicians are overbooked, more traffic only amplifies the operational problem.
The visual timeline includes illustrative labels such as “500 monthly searches” and a “3% conversion rate.” Treat those as planning examples from the graphic, not universal benchmarks. Your own dashboard should use verified search, call, booking, margin, and capacity data.
KPIs, Pitfalls, and Your Execution Checklist
A local market-share system needs more than ranking positions. Track map-pack visibility by service city, calls by source, booked jobs, completed work, revenue per technician or site, realized price versus list, category breadth, fulfillment quality, and share of local growth. The BatchData marketing strategies for contractors offers additional context for connecting contractor marketing activity with operational execution.
Rapid share expansion can strain capacity. If the phone rings more often but the team responds slowly, misses appointments, or discounts heavily to keep the schedule full, the business may trade margin and reputation for temporary volume. Monitor competitor responses as well, because a rival may increase ad spend, improve its review process, or target the same suburb.
Start this week
- Define the boundary: List the service cities, categories, customer types, and channels you will measure.
- Audit the map: Record competitors and your positions for each priority service-city search.
- Fix the profile: Correct categories, services, hours, photos, contact details, and service areas.
- List transactional terms: Include “near me,” “price,” “emergency,” “repair,” “replacement,” and city-specific phrases where relevant.
- Build the silos: Map each term to a useful service or location page with a clear conversion path.
- Set the cadence: Review calls, bookings, rankings, reviews, revenue, margin, and capacity on a regular schedule.
Transactional LLC provides local SEO, Google Maps optimization, industry-specific content silos, AI-driven publishing support, website management, and paid campaigns for service businesses. If you want to measure market share through the transactional searches that produce calls and booked work, visit Transactional LLC and request a focused review of your service areas.