


Your roofing company's report shows more impressions and better rankings, but your office hasn't booked more estimates. You open another screen to check calls, then another to find completed jobs. By the time you've compared them, you still can't tell which service city needs attention.
A useful SEO reporting dashboard should make that decision easier. It should preserve the history behind each trend and connect search activity to qualified contacts and booked work, without pretending that a map view is a customer.
What an SEO Reporting Dashboard Is and Its Layout
An SEO reporting dashboard brings selected measurements from separate tools into a shared reporting view. Each panel needs a named source, reporting period, comparison period, and explanation of what the numbers represent. Otherwise, you're looking at totals without enough context to act.
For a roofing business, arrange the dashboard in the order an owner asks questions: Are we getting inquiries? Where are people finding us? What are they doing? Which inquiries become jobs?
Dashboard panels for a local service business
| Panel | Contents | Source | Refresh |
|---|---|---|---|
| Summary row | Clicks, calls and booked jobs with trend arrow | Search Console, Business Profile, CRM | Weekly |
| Search visibility | Query groups and service pages, transactional terms apart from brand | Search Console Performance report | Weekly |
| Profile actions | Views on Search and Maps, calls, directions, website clicks by location | Google Business Profile | Monthly export |
| Outcome view | Tracked calls matched to booked jobs and revenue by service city | Call tracking and CRM | Daily at job close |
These refresh intervals are a recommended operating schedule, not a promise that every platform publishes finalized data on that schedule.
Read from the summary to the evidence
The summary row helps you spot a change quickly. Label its calls card precisely, such as tracked incoming calls, rather than using a vague leads label. Keep booked jobs visible so a rise in activity doesn't automatically look like business growth.
The visibility panel should separate transactional searches, such as roofer near me, from searches containing your company name. Transactional Marketing focuses on these hiring-oriented terms because they indicate someone is looking for a service provider, although the search alone doesn't prove that person will hire you.
The profile panel explains local engagement. The outcome panel adds service-city and job information from your operational records, including revenue when your CRM captures it.
Layout rule: Every panel should help the owner identify a change, inspect its evidence, or choose an action.
Put a footer beneath each panel with its source, date range, last successful refresh, and any missing-data flag. A blank connection should say data unavailable, not display a reassuring zero.
Core Metrics Every Local SEO Dashboard Should Track
Organize your metrics into search visibility, profile actions, and business outcomes. These layers describe different stages of customer acquisition, so don't combine them into a single success score.
The Google Search Console Performance report defines clicks, impressions, CTR, and average position, with filters for queries, pages, countries, and devices and comparisons between reporting periods. Those dimensions help you investigate a change rather than relying on an overall website average.
Core dashboard metrics, sources and common misreadings
| Metric | Source | What It Answers | Common Misreading |
|---|---|---|---|
| Clicks | Search Console Performance report | Visits from Google results | Treating clicks as total website traffic |
| Impressions | Search Console Performance report | How often a result was shown | Reading impressions as proof of demand |
| CTR | Search Console Performance report | Share of impressions that earned a click | Blaming low CTR on rankings alone |
| Average position | Search Console Performance report | Typical ranking across queries | Trusting one average for every service city |
| Profile views | Google Business Profile | Views on Search and on Maps | Adding Search and Maps views into one undifferentiated total |
| Calls | Google Business Profile | Clicks on the call button | Assuming every call becomes a booked job |
| Direction requests | Google Business Profile | Requests for navigation to the business | Counting them as confirmed visits |
| Booked jobs | CRM or booking system | Revenue-producing outcome | Left out because collection is harder |
Understand what each layer measures
An impression means a search result was shown. A click means someone selected it. CTR, or click-through rate, is clicks divided by impressions, while average position summarizes the position of your highest-ranking result across recorded impressions.
None of those measurements tells you whether a roofing estimate was scheduled. Also, Search Console's country dimension isn't a substitute for city-level reporting. Use geographic rank tracking and CRM service addresses when you need to assess coverage across individual cities.
Profile views describe exposure on Search or Maps. Profile calls describe call-button clicks, and direction requests describe navigation requests, as explained in Google's Business Profile performance definitions. Keep website clicks alongside them, rather than treating call activity as the only useful interaction.
For a closer look at the reporting interface, our guide to Google Business Profile insights explains how to interpret profile activity.
Add operational definitions
A qualified lead is a contact that meets your written service, geography, and customer criteria. A booked job is work recorded as scheduled in your booking system. Realized revenue is the amount recorded after the work reaches your chosen accounting milestone, not an estimate's potential value.
For roofer near me queries, compare the landing page receiving clicks with the service the prospect requests. Roof-repair inquiries and replacement estimates may have different business value.
Every metric needs a name, a source, and a date range, or it doesn't belong on the dashboard.
Separating Map Visibility From Calls and Visits
Map visibility describes exposure. Profile actions describe what someone did after encountering the business. Tracked contacts and website sessions add another layer of evidence, but they aren't interchangeable with either.
Google's Business Profile interaction documentation identifies actions including calls, website clicks, bookings, chats, and direction requests where available. A call records a click on the profile's call button, a website click records selection of its website link, and a direction request records a request for navigation.
Say a roofing company sees stronger map visibility around an outer service city. Profile calls rise slightly, but website clicks stay flat. The immediate conclusion is that people may be contacting the business directly from the profile, not that the website has failed.
Test the explanation before changing the page
To assess the service page, examine what happens after visitors arrive. If relevant website sessions increase but contact submissions don't, inspect the mobile phone link, estimate form, service-area wording, and contact path. Flat profile website clicks alone can't establish a landing-page conversion problem.
This comparison keeps the investigation focused:
| Evidence | What it supports | What it doesn't establish |
|---|---|---|
| More map exposure | Broader visibility in the measured area | More qualified prospects |
| More profile call clicks | More attempts to contact the business | Answered conversations |
| More tracked conversations | More actual phone contact | More scheduled estimates |
| More booked jobs | More recorded work | SEO as the sole cause |
Google also cautions that profile website-click totals can differ from Search performance totals because the reports measure different surfaces. Don't add the figures together and label the result unique visitors.
Keep each source identifiable
Use phone-call tracking to inspect which contacts reached your office and what happened next. Keep the call's source, timestamp, service city, qualification status, and CRM job identifier available for review.
Transactional Marketing provides regular GMB performance reporting, including insights into customer actions, through our dashboards and automatic system communications. These records let owners review activity alongside optimization work targeting transactional searches such as roofer near me.
A profile action is evidence of interest. A matched job record is evidence of a business outcome.
Keep profile calls, directions, profile website clicks, Search clicks, organic sessions, tracked calls, and form submissions in separate fields. Compare them by location and reporting period, without forcing different measurements to match.
How to Build the Dashboard in Seven Steps
Build the connections and definitions before choosing chart colors. Looker Studio can display the information, while Google Sheets or a database can hold archived exports. Your CRM should remain the source for job status.
The process below keeps access, geographic reporting, and outcome matching in a practical order.
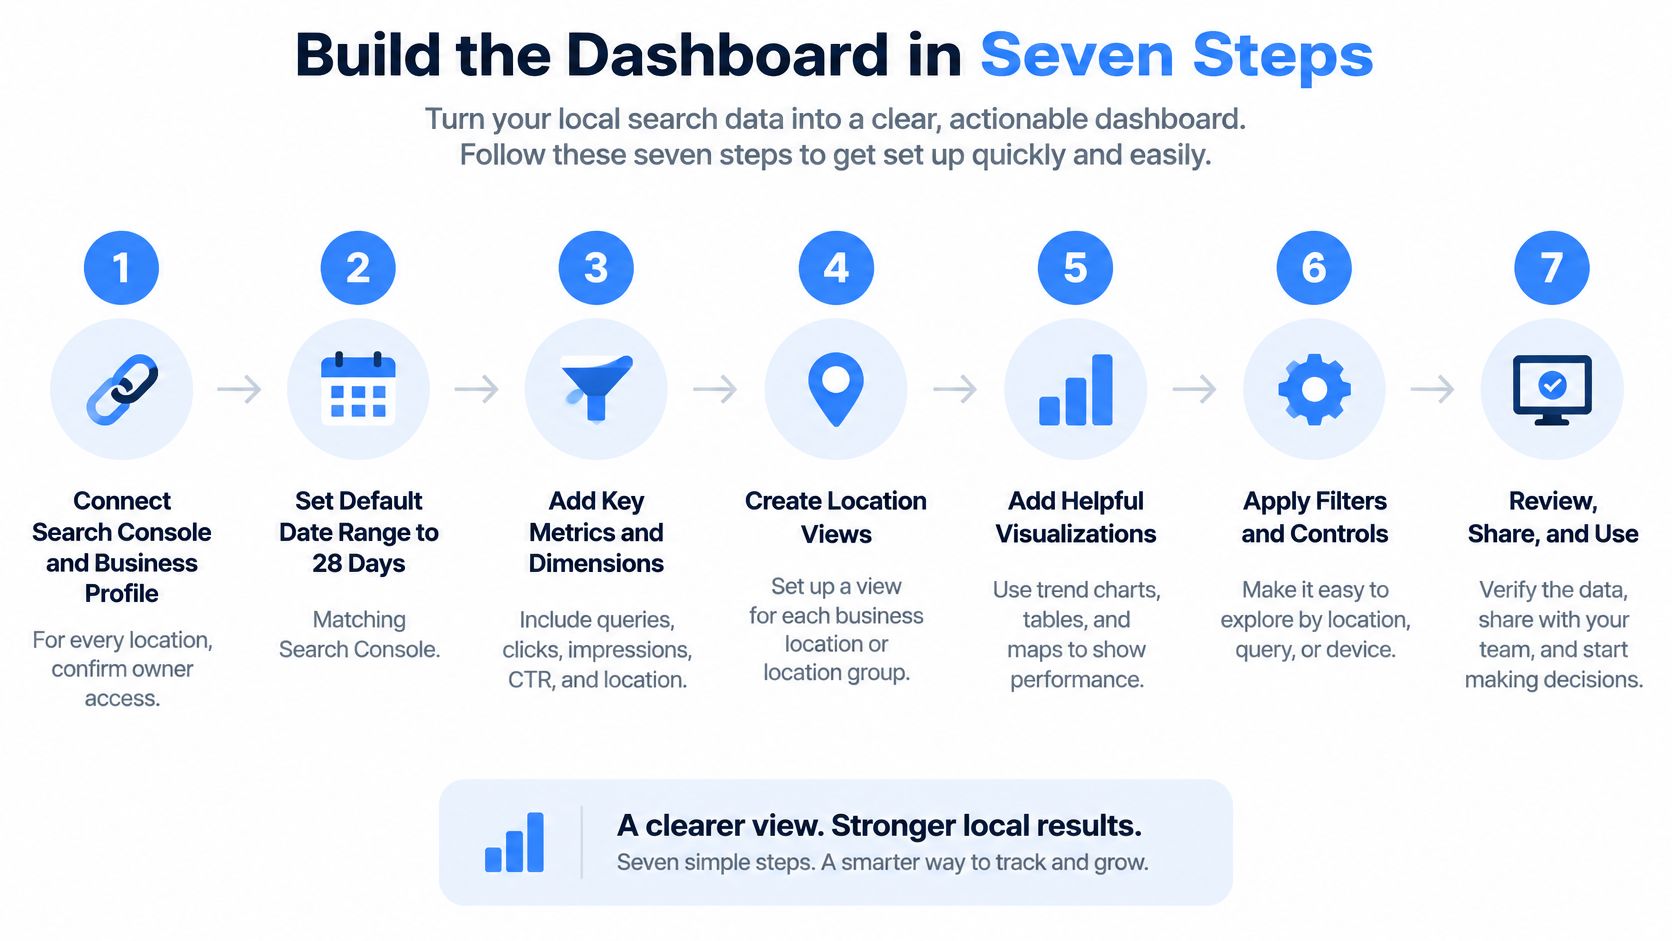
Connect and organize the evidence
Connect Search Console and Business Profile for every location, confirming that the business retains ownership access so an account change won't cut off reporting. Keep a connection register with the property, profile identifier, responsible account, and last successful import. A service city without a physical business location should be a reporting segment, not an invented profile.
Choose a consistent default date range, using the previous three months for the main trend view so a short fluctuation doesn't dominate the review. Add the matching period from the previous year when archived records exist. Use a shorter operational view when investigating recent changes, but label it separately rather than implying it is a universal platform default.
Create a dashboard page or filtered view for each service city, and tag queries and landing pages by service so your largest market doesn't conceal a weaker one. Keep company-name searches apart from roofing hiring terms. Distinguish a city named in a query from a customer's actual service address, since those fields answer different questions.
Add the available Business Profile fields, including separate Search and Maps exposure, calls, direction requests, and website clicks, so each location's engagement remains inspectable. Store the original field name as well as your plain-language dashboard label. That makes later metric-definition changes easier to audit.
Match outcomes and establish the review
Connect call tracking to the CRM or booking system, using a contact or job identifier wherever possible so repeated calls don't become repeated leads. Record missed calls, qualification, requested service, and booking status. Put unmatched contacts into a review queue instead of counting them as successful acquisitions.
Build the summary row first, showing clicks, clearly defined calls, and booked jobs with comparison arrows so the owner can identify where to investigate. Preserve the counts behind each arrow. A change without its baseline can exaggerate progress or make ordinary variation look alarming.
Assign a review and archive schedule, with a weekly check of calls and jobs and a monthly export of source records so someone owns both performance decisions and data continuity. Capture job changes at close, and test that scheduled exports arrived. Give each issue an owner, an action, and a review date.
Transactional's live dashboards show rankings, heat maps, website traffic, and call tracking. Prospective customers can submit an intake form to see how their own company is performing across its service area, and our free Google Maps audit provides a starting point for that assessment.
Your first action this month: export the main Search Console reporting window for your highest-value city's transactional query group. Record its current profile actions, verify the landing pages receiving clicks, and set a written target and review date for each measurement you intend to improve.
Keeping Historical Data Reliable Across Seasons
Native data windows and recommended archive frequency
| Data Source | Native History | Archive Frequency | What to Watch |
|---|---|---|---|
| Search Console performance | Up to 16 months | Monthly snapshot by date range | Newest data can be preliminary and change |
| Business Profile performance | Up to six months | Monthly export or API pull | Interaction totals differ across reporting areas |
| Business Profile search terms | Updated monthly, up to five days late | Monthly, after the update | Terms show how people found the profile |
| Tracked calls | Tool-specific retention policy | Weekly, with matched jobs | Confirm the call-tracking tool's retention setting |
| CRM booked jobs | Account retention and deletion policy | Daily at job close | Confirm the CRM's export settings |
Google's Search Console documentation describes a 16-month history window and warns that the newest Performance data can be preliminary. Google's Business Profile reporting guidance describes performance availability of up to six months, making external retention important for seasonal comparisons.
Business Profile search-term reporting can take up to five days after the beginning-of-month update to appear, according to Google's performance definitions linked earlier. Schedule the archive after the update completes, then verify that the expected reporting period is present.
Preserve records, not just screenshots
For a roofing company, a spring increase in estimate requests is useful context for next spring's staffing and SEO decisions. A dashboard that only retrieves currently available records may not preserve that context.
Archive the underlying exports with:
- Location identifiers: Keep the profile identifier, service-city segment, and reporting dates.
- Collection details: Save the extraction timestamp and source field names.
- Definition notes: Record when a metric changes meaning or becomes unavailable.
- Outcome history: Preserve call-to-job matches and later status changes.
Search Console supports adjustable reporting granularity, but changing a chart to monthly doesn't create an archive. You need stored source records that remain available independently of the live connector.
Compare only the history you can verify
To validate a long-term trend, check that each reporting month has a saved snapshot and a consistent definition. Mark missing periods as gaps rather than replacing them with estimated values that look observed.
Archive safeguard: Missing history is unknown, not zero.
When a newer location lacks comparable history, compare the locations over their shared complete period. Show the older location's longer trend separately. If definitions changed, preserve the original series and start a clearly labeled comparable series rather than joining incompatible totals.
Reading Results Without Fooling Yourself
The tempting conclusion is that rising impressions prove the campaign is working, even when clicks and booked estimates haven't moved. They prove increased exposure within the report's scope, not increased business.
If impressions rise while clicks stay flat, inspect query mix, CTR, ranking, and search-result presentation before declaring success or failure. A newly visible informational page can change the overall trend without improving your core roofing hiring terms.
This is the kind of disagreement worth investigating rather than smoothing over.
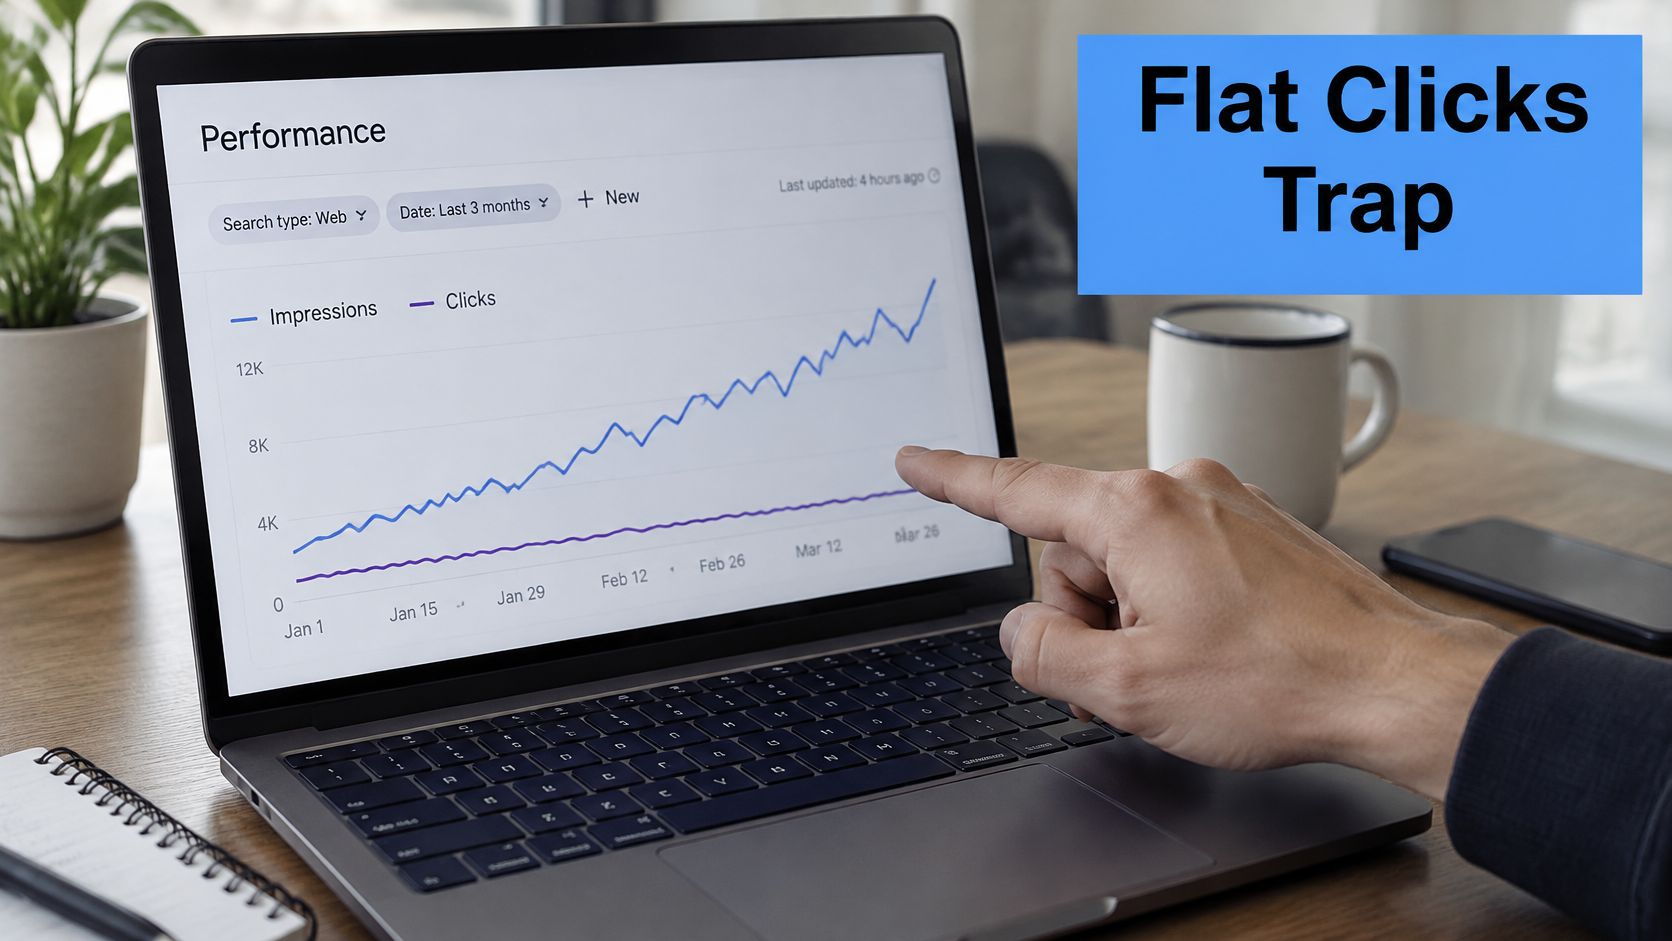
Symptoms, likely causes and the check to run first
| Symptom | Likely Cause | First Check |
|---|---|---|
| Impressions rise, clicks flat | Lower CTR or changed result display | CTR by query and page over the same date range |
| Calls rise, booked jobs flat | Calls misclassified or from paid sources | Split calls by source and match them to CRM jobs |
| Map views rise, website clicks flat | Direct profile contact or a weak website path | Profile actions, then the landing page and contact path for that service and city |
| Average position improves, calls unchanged | Gains outside core service areas | Heat map by service area |
| Traffic drops on one page | Seasonal demand or a site change | Same period last year for that page |
Separate attribution from timing
A call increase after a service-page update doesn't prove the update caused it. Seasonal demand, paid advertising, repeat customers, or referral activity can change the same period's results.
Google's Business Profile performance guidance notes that performance reporting can include activity from both organic results and Google Ads. Separate paid and organic contacts wherever your tracking supports it, and leave uncertain sources labeled unknown rather than assigning them to SEO.
Use performance benchmarking to compare like periods and comparable service areas. Inspect job type and gross margin too, since more low-value inquiries may not support your business goals.
Allow for lag and imperfect records
Most businesses see ranking improvements within 3–6 months of ongoing SEO efforts. That's a planning expectation, not a guaranteed deadline or proof that every subsequent booking came from optimization.
Show these flags on the readout:
- Data loss: Identify disconnected sources and incomplete imports.
- Duplicate leads: Merge repeated contacts without deleting the underlying activity.
- Call misclassification: Separate missed calls, existing customers, irrelevant inquiries, and qualified prospects.
- Definition differences: Flag incompatible Business Profile totals.
A credible funnel runs from search exposure to profile action, tracked contact, qualified lead, booked job, and realized revenue. State the attribution rule and observed lag beside each stage. Don't imply that aggregate search records identify the exact query behind every phone call.
Tracking AI Search Visibility Alongside Rankings
Google's guidance for AI features says the foundations remain technical eligibility, Search-policy compliance, and helpful, reliable, people-first content. Businesses don't need special AI files, AI text files, or new machine-readable markup, and structured data isn't a prerequisite for generative AI visibility.
AI-generated answers add another place to inspect whether people can discover your business. Keep those observations distinct from verified website visits and contacts.
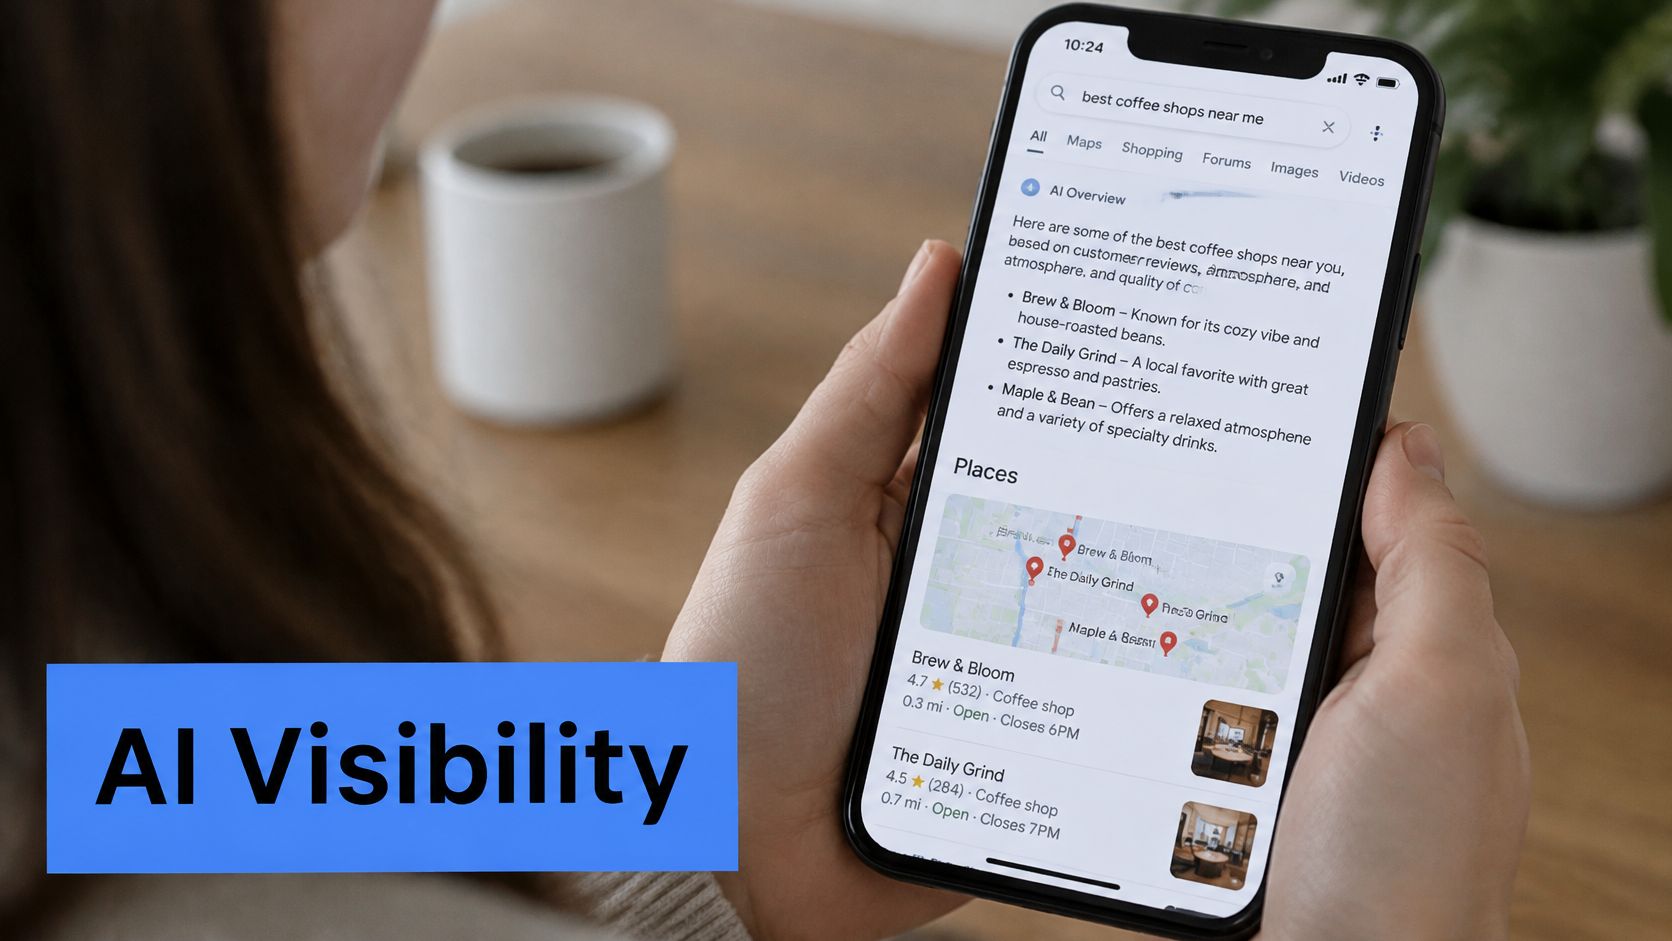
Measure eligibility and appearances separately
For a roofing dashboard, track indexed service and city pages, technical issues, service-page updates, and whether structured data accurately matches visible content. Log AI-feature checks for priority queries with the date, location, interface, cited page, and whether the business appeared.
An observed appearance isn't a stable ranking or an attributed lead. For LLM-based discovery, record identifiable referral visits separately and label untraceable customer-reported sources.
For broader terminology and measurement ideas, Bluelight's guide to AI search visibility offers a complementary resource. Our explanation of AI search engine optimization connects this work to local service discovery.
The video below provides another format for exploring the topic.
Treat proprietary AI-schema shortcuts cautiously. Follow a practical order: conventional search health first, documented AI appearances next, then the contacts and booked jobs you can connect to them.
Transactional LLC offers local SEO, Google Maps optimization, and live dashboards that help you inspect rankings, map coverage, website traffic, and calls. Visit Transactional LLC to request a free Google Maps audit and submit your company for a service-area dashboard review focused on transactional searches and the work they generate.